Failure 03 · The classic NaN
Log Of Zero In The Loss
- A softmax output
- A log
- One epsilon
Training
Forty-two ways training fails, and what each one looks like before it fails: the NaN, the curve that never moves, the one that falls then explodes, and the quiet one where everything looks fine and the model learned nothing useful.
Secure checkout · Instant download · 60-day guarantee
Forty-two failures across six chapters — NaNs, flat losses, instability, overfitting, data faults and the silent ones.
Sound familiar?
Training failures all look the same from the outside — a number that misbehaves — so the response becomes ritual. Lower the learning rate, add a normalisation layer, try again, and hope. Sometimes it works, which is worse, because it teaches you nothing.
Each failure has a shape. A NaN from an exploding gradient looks different from a NaN from a log of zero. A flat loss from a dead activation looks different from a flat loss from a label that never changes. Once you can tell them apart, the fix follows.
Sample pages
Each failure shows the curve, what it tells you, the likely causes in order of probability, and how to confirm which one it is before changing anything.
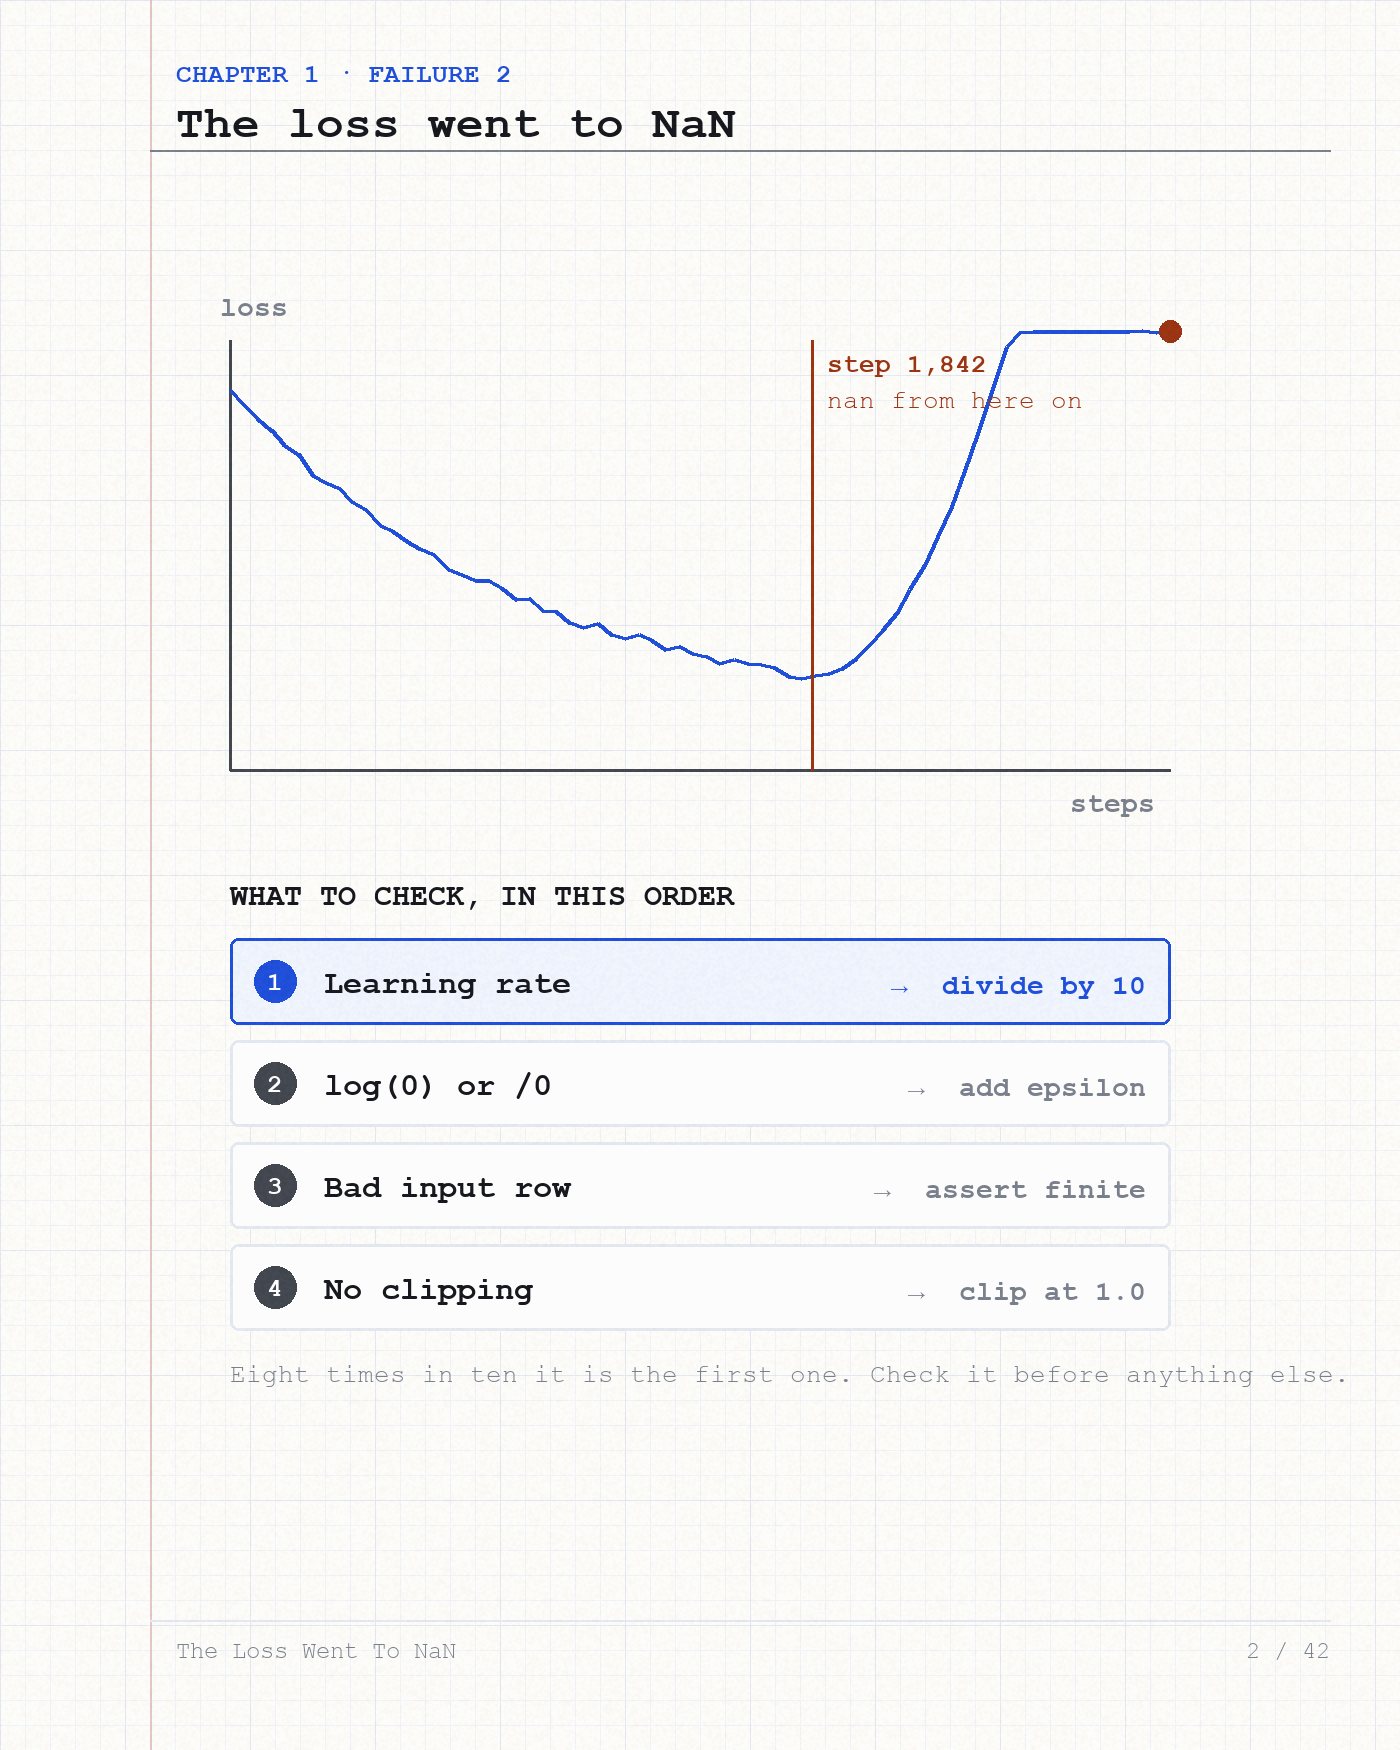
Failure 03 · The classic NaN
Failure 17 · The flat line
Failure 29 · The quiet one
42 training failures in total
A model that scores well and learned the wrong thing is the most expensive failure here. Those get their own chapter, with the checks that reveal them.
What's inside
It is organised by symptom, not by technique — you arrive with a curve that looks wrong and leave knowing which measurement settles it.
Every entry names the confirming measurement first. Changing the learning rate to see what happens is explicitly the thing this book is against.
Causes are listed most-likely first, so you check the cheap common one before the exotic one.
A whole chapter on runs that complete, report good numbers, and are worthless — because those cost weeks rather than hours.
What you get
Forty-two failures across six chapters — NaNs, flat losses, instability, overfitting, data faults and the silent ones.
The offer
The Loss Went To NaN is forty-two training failures organised by symptom — the curve, what it rules out, the likely causes in order, and the measurement that confirms which one you have.
Instant digital download. One-time payment of $10.00. Educational material about how neural networks work — not a course, not a certification, and not a promise about employment or salary.
Questions
No — and the book argues against that reflex explicitly. Every entry names a measurement that distinguishes its cause from the others before any change is suggested.
Only where tuning is the actual fix. Most of these failures are not tuning problems, which is why tuning them feels like luck.
The diagnoses are framework-independent; the measurement snippets are PyTorch, with NumPy equivalents where it helps.
No. Where a failure needs a gradient or a shape explained, it is explained in place.
It will stop it failing for reasons you cannot name. Whether a model reaches useful accuracy depends on the data and the problem, and no book can promise that.
No — it's a digital guide (PDF), emailed to you right after purchase. Nothing is shipped.
You're protected by a 60-day money-back guarantee. Email us within 60 days for a full refund — no questions asked.
Match the curve, read the likely causes, take the one measurement that settles it.
Secure checkout · Instant download · 60-day guarantee
This is educational material about how neural networks work. It is not a course, a certification, a bootcamp or a career programme, and it makes no promise about employment, salary or professional outcomes of any kind. The code and the worked figures are teaching examples, written for clarity rather than for production: read them, adapt them, and test anything you reuse. Library APIs change often, so the method is what carries over, not the exact call signature. Nothing here is professional, legal or financial advice. Models reproduce the patterns and the biases of the data they are trained on; deploying one that affects people carries responsibilities this book does not cover.